|
Pyrogenesis
trunk
|
New profiler (complementing the older CProfileManager) More...
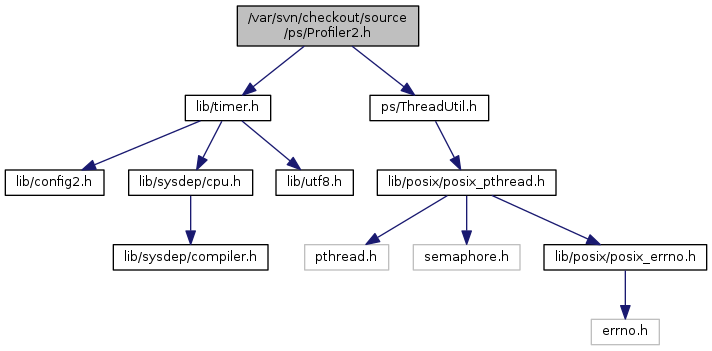

Go to the source code of this file.
Classes | |
| class | CProfiler2 |
| struct | CProfiler2::SItem_dt_id |
| An item with a relative time and an ID string pointer. More... | |
| class | CProfiler2::ThreadStorage |
| Class instantiated in every registered thread. More... | |
| struct | CProfiler2::ThreadStorage::HoldBuffer |
| class | CProfile2Region |
| Scope-based enter/leave helper. More... | |
| class | CProfile2SpikeRegion |
| Scope-based enter/leave helper. More... | |
| class | CProfile2AggregatedRegion |
| Scope-based enter/leave helper. More... | |
| class | CProfile2GPURegion |
| Scope-based GPU enter/leave helper. More... | |
Macros | |
| #define | PROFILE2(region) CProfile2Region profile2__(region) |
| Starts timing from now until the end of the current scope. More... | |
| #define | PROFILE2_IFSPIKE(region, limit) CProfile2SpikeRegion profile2__(region, limit) |
| #define | PROFILE2_AGGREGATED(region, limit) CProfile2AggregatedRegion profile2__(region, limit) |
| #define | PROFILE2_GPU(region) CProfile2GPURegion profile2gpu__(region) |
| #define | PROFILE2_EVENT(name) g_Profiler2.RecordEvent(name) |
| Record the named event at the current time. More... | |
| #define | PROFILE2_ATTR g_Profiler2.RecordAttribute |
| Associates a string (with printf-style formatting) with the current region or event. More... | |
Variables | |
| CProfiler2 | g_Profiler2 |
New profiler (complementing the older CProfileManager)
The profiler is designed for analysing framerate fluctuations or glitches, and temporal relationships between threads. This contrasts with CProfilerManager and most external profiling tools, which are designed more for measuring average throughput over a number of frames.
To view the profiler output, press F11 to enable the HTTP output mode and then open source/tools/profiler2/profiler2.html in a web browser.
There is a single global CProfiler2 instance (g_Profiler2), providing the API used by the rest of the game. The game can record the entry/exit timings of a region of code using the PROFILE2 macro, and can record other events using PROFILE2_EVENT. Regions and events can be annotated with arbitrary string attributes, specified with printf-style format strings, using PROFILE2_ATTR (e.g. PROFILE2_ATTR("frame: %d", m_FrameNum) ).
This is designed for relatively coarse-grained profiling, or for rare events. Don't use it for regions that are typically less than ~0.1msecs, or that are called hundreds of times per frame. (The old CProfilerManager is better for that.)
New threads must call g_Profiler2.RegisterCurrentThread before any other profiler functions.
The main thread should call g_Profiler2.RecordFrameStart at the start of each frame. Other threads should call g_Profiler2.RecordSyncMarker occasionally, especially if it's been a long time since their last call to the profiler, or if they've made thousands of calls since the last sync marker.
The profiler is implemented with thread-local fixed-size ring buffers, which store a sequence of variable-length items indicating the time of the event and associated data (pointers to names, attribute strings, etc). An HTTP server provides access to the data: when requested, it will make a copy of a thread's buffer, then parse the items and return them in JSON format. The profiler2.html requests and processes and visualises this data.
The RecordSyncMarker calls are necessary to correct for time drift and to let the buffer parser accurately detect the start of an item in the byte stream.
This design aims to minimise the performance overhead of recording data, and to simplify the visualisation of the data by doing it externally in an environment with better UI tools (i.e. HTML) instead of within the game engine.
The initial setup of g_Profiler2 must happen in the game's main thread. RegisterCurrentThread and the Record functions may be called from any thread. The HTTP server runs its own threads, which may call the ConstructJSON functions.
| #define PROFILE2 | ( | region | ) | CProfile2Region profile2__(region) |
Starts timing from now until the end of the current scope.
region is the name to associate with this region (should be a constant string literal; the pointer must remain valid forever). Regions may be nested, but preferably shouldn't be nested deeply since it hurts the visualisation.
| #define PROFILE2_AGGREGATED | ( | region, | |
| limit | |||
| ) | CProfile2AggregatedRegion profile2__(region, limit) |
| #define PROFILE2_ATTR g_Profiler2.RecordAttribute |
Associates a string (with printf-style formatting) with the current region or event.
(If the last profiler call was PROFILE2_EVENT, it associates with that event; otherwise it associates with the currently-active region.)
| #define PROFILE2_EVENT | ( | name | ) | g_Profiler2.RecordEvent(name) |
Record the named event at the current time.
| #define PROFILE2_GPU | ( | region | ) | CProfile2GPURegion profile2gpu__(region) |
| #define PROFILE2_IFSPIKE | ( | region, | |
| limit | |||
| ) | CProfile2SpikeRegion profile2__(region, limit) |
| CProfiler2 g_Profiler2 |
 1.8.11

